ERCOT Price Gouging
Welcome to the Deregulated State of Texas!
During the crisis brought on by government failure and capitalism last week in Texas that caused millions of people to suffer in freezing temperatures and suffer without water, some Texans received egregious electricity bills.
I found the historical data on Electric Reliability Council of Texas (ERCOT) settlement point prices here. ERCOT manages the power grid system in Texas. According to the Quick Facts from ERCOT, “it also performs financial settlement for the competitive wholesale bulk-power market and administers retail switching for seven million premises in competitive choice areas.”
Below I plot Daily-Ahead Market Settlement Point Prices (DAM SPP). According to ERCOT website, “The Day-Ahead Market (DAM) is a voluntary, financially-binding forward energy market. The DAM matches willing buyers and sellers, subject to network security and other constraints…”
library(tidyverse)
library(lubridate)
library(scales)

ercot_dat <- read_csv("https://raw.githubusercontent.com/meghapsimatrix/datasets/master/ercot/ercot_dam_spp.csv")

glimpse(ercot_dat)
## Rows: 7,200
## Columns: 5
## $ delivery_date <chr> "02/01/2021", "02/01/2021", "02/01/2021", "02/…
## $ hour_ending <time> 01:00:00, 01:00:00, 01:00:00, 01:00:00, 01:00…
## $ repeated_hour_flag <chr> "N", "N", "N", "N", "N", "N", "N", "N", "N", "…
## $ settlement_point <chr> "HB_BUSAVG", "HB_HOUSTON", "HB_HUBAVG", "HB_NO…
## $ settlement_point_price <dbl> 20.04, 20.19, 19.91, 20.80, 21.08, 17.42, 21.2…# not collapsing across hours
summary(ercot_dat$settlement_point_price)## Min. 1st Qu. Median Mean 3rd Qu. Max.
## -30.04 20.75 38.42 2071.37 3174.66 9052.53The data contains SPPs for different Hubs and Load Zones (these care called settlement points in the data):
unique(ercot_dat$settlement_point)## [1] "HB_BUSAVG" "HB_HOUSTON" "HB_HUBAVG" "HB_NORTH" "HB_PAN"
## [6] "HB_SOUTH" "HB_WEST" "LZ_AEN" "LZ_CPS" "LZ_HOUSTON"
## [11] "LZ_LCRA" "LZ_NORTH" "LZ_RAYBN" "LZ_SOUTH" "LZ_WEST"The data from ERCOT contains DAM SPPs by hour of the day. I plot average DAM SPP per day across hours. The DAM SPPs increased to nearly $9,000 during the crisis last week!!!
ercot_dat %>%
  mutate(delivery_date = mdy(delivery_date)) %>%
  group_by(delivery_date) %>%
  summarize(mean_spp = mean(settlement_point_price)) %>%
  ggplot(aes(x = delivery_date, y = mean_spp)) +
  geom_point(alpha = .5) +
  geom_line(color = "blue") +
  scale_y_continuous(breaks = seq(0, 10000, 1000),
                     label = comma) +
  scale_x_date(breaks = pretty_breaks(10)) +
  labs(x = "Date", y = "Average Day-Ahead Market Settlement Point Price") +
  theme_bw()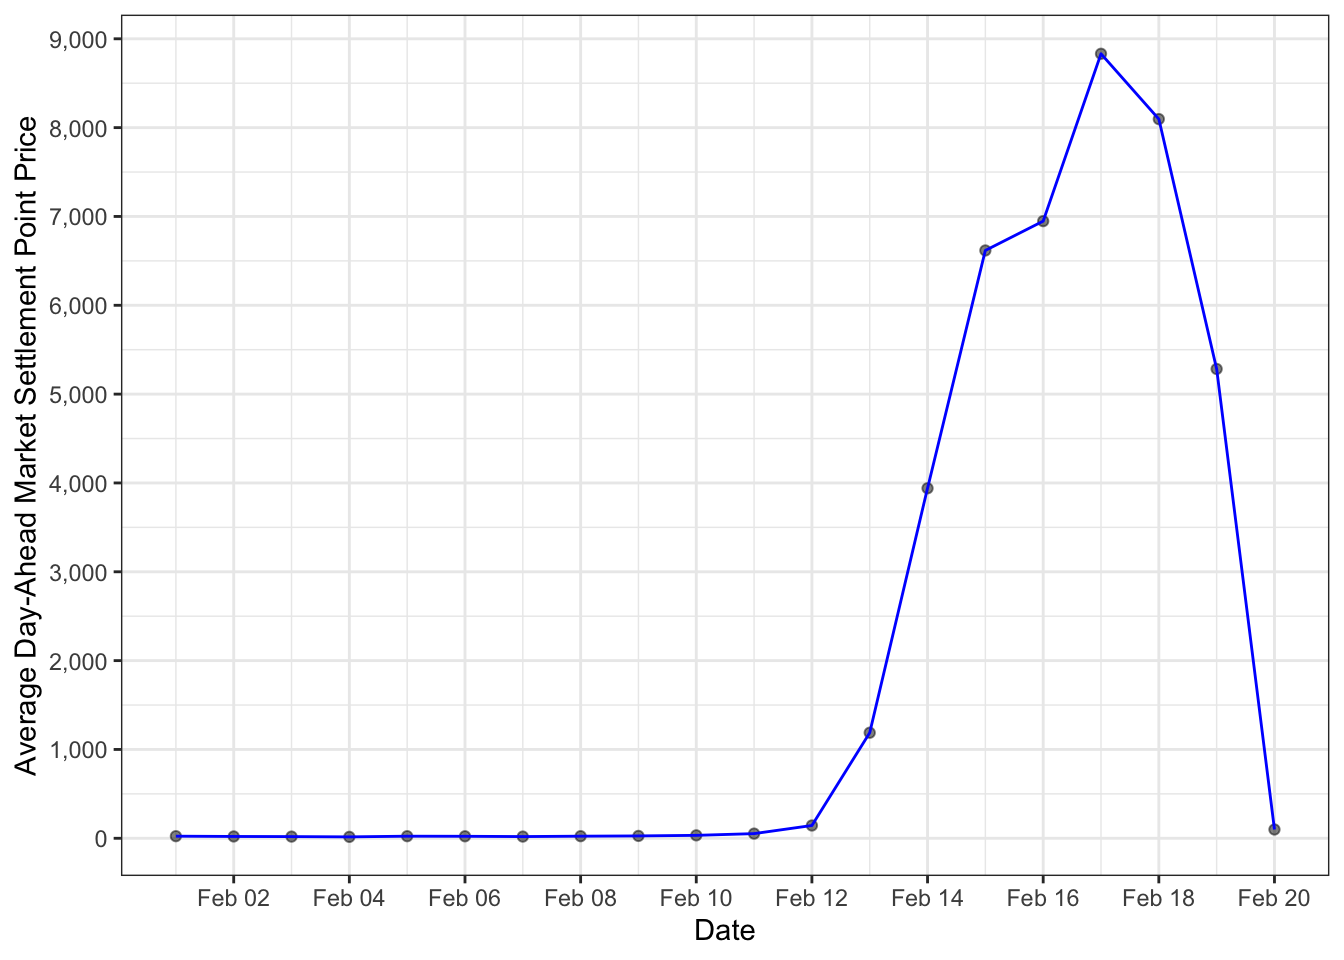
Make utilities public!