Tidy Tuesday Horror
Load the Data and Check Duplicates
library(tidyverse)
library(lubridate)
library(kableExtra)
library(ggridges)


# there were complete duplicated rows
dat <- read_csv("https://raw.githubusercontent.com/rfordatascience/tidytuesday/master/data/2019/2019-10-22/horror_movies.csv") %>%
  distinct(.) # removes complete dups

# check duplicates
dup_title <- dat %>%
  filter(duplicated(title) | duplicated(title, fromLast = TRUE)) %>%
  arrange(title)

# examined they seem different movies even though same title
dup_title %>%
  filter(duplicated(plot))
## # A tibble: 0 x 12
## # … with 12 variables: title <chr>, genres <chr>, release_date <chr>,
## # release_country <chr>, movie_rating <chr>, review_rating <dbl>,
## # movie_run_time <chr>, plot <chr>, cast <chr>, language <chr>,
## # filming_locations <chr>, budget <chr>dup_title %>%
filter(duplicated(release_date)| duplicated(release_date, fromLast = TRUE))## # A tibble: 2 x 12
## title genres release_date release_country movie_rating review_rating
## <chr> <chr> <chr> <chr> <chr> <dbl>
## 1 The … Comed… 21-Jul-15 USA <NA> 5.2
## 2 The … Comed… 21-Jul-15 USA NOT RATED 3.6
## # … with 6 more variables: movie_run_time <chr>, plot <chr>, cast <chr>,
## # language <chr>, filming_locations <chr>, budget <chr># The Jokesters seems to be a duplicate but with different rating and run time
# Deleting it for now
dat <- dat %>%
filter(title != "The Jokesters (2015)")Genres
The genre column looked extremely messy so some data munging fun. Each film can be categorized into multiple genres.
dat_long <- dat %>%
  separate_rows(genres, sep = "\\|") %>% # long format
  mutate(genres = str_trim(genres))

# Just to check - looks okay - just 1 movie with no genre
table(dat_long$genres, useNA = "ifany")
##
## Action Adult Adventure Animation Biography Comedy
## 335 1 115 39 4 511
## Crime Drama Family Fantasy History Horror
## 120 529 11 229 6 3309
## Music Musical Mystery Reality-TV Romance Sci-Fi
## 5 13 453 1 99 308
## Sport Thriller War Western <NA>
## 4 1369 14 15 1dat_long <- dat_long %>%
mutate(genres = fct_infreq(fct_lump(genres, n = 8))) # Factor keeping 8 most frequent categories and lumping the rest to Other and order the factor by frequencyTable: Number of Films per Genre
genre_count <- dat_long %>%
  filter(!is.na(genres)) %>%
  group_by(genres) %>%
  summarize(n = n()) %>%
  ungroup()

kable(genre_count, format = "html", table.attr = "style = \"color: white;\"") %>%
kable_styling(bootstrap_options = "striped", full_width = F)| genres | n |
|---|---|
| Horror | 3309 |
| Thriller | 1369 |
| Drama | 529 |
| Comedy | 511 |
| Mystery | 453 |
| Other | 447 |
| Action | 335 |
| Sci-Fi | 308 |
| Fantasy | 229 |
Bar Graph: Distribution of Genres
genre_count %>%
  ggplot(aes(x = genres, y = n, fill = genres)) +
  geom_bar(stat = "identity") +
  scale_y_continuous(labels = scales::comma) +  # y axis to have commas
  scale_fill_brewer(palette ="BuPu", direction = -1) + # reverse order the palette
  theme_light() +
  labs(x = "", y = "Number of Films") +
  theme(legend.position = "none")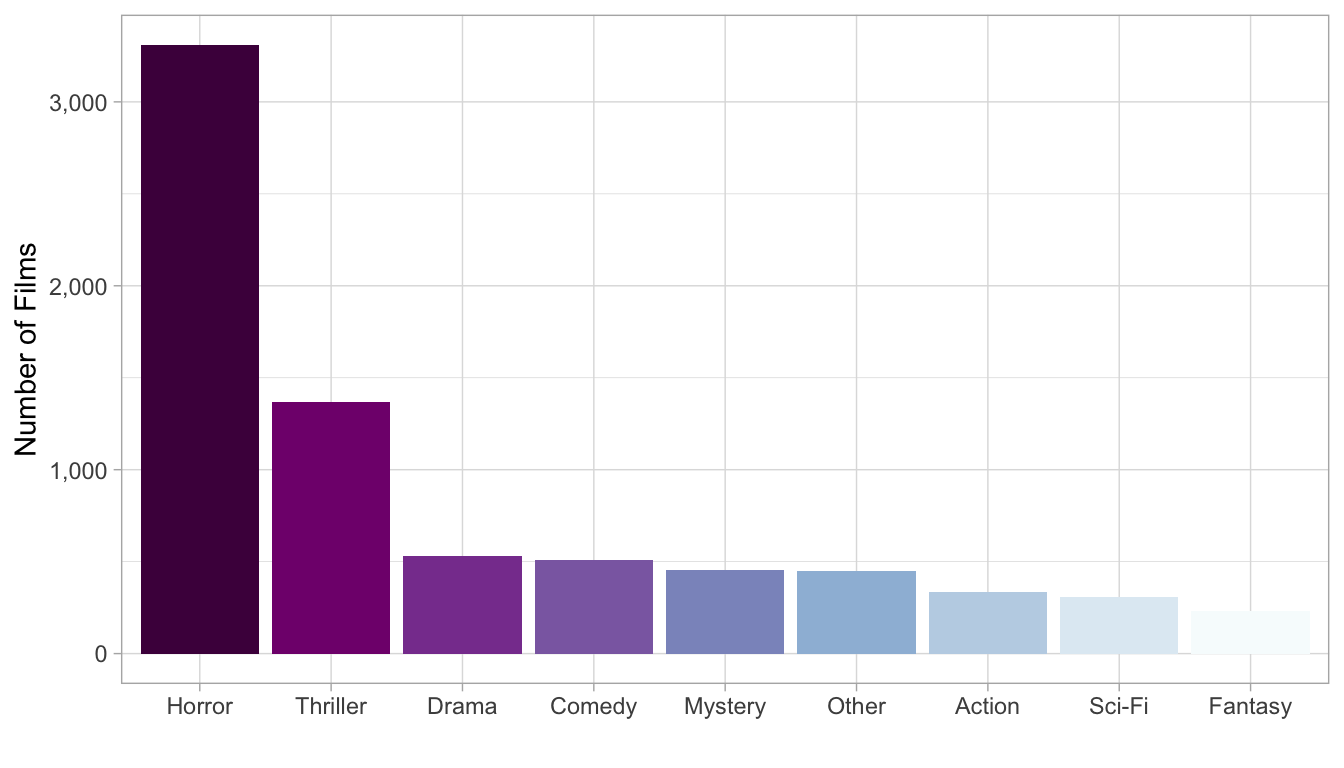
Review Rating by Release Year
Some of the years are dmy format, some just have the years. I am extracting the year and filling in any that didn’t parse with the year value from the original release_date column. No missing values for year :)
date_dat <- dat %>%
  mutate(date = dmy(release_date),
         yr = year(date),
         yr = ifelse(is.na(yr), release_date, yr))

table(is.na(date_dat$yr))
##
## FALSE
## 3310table(is.na(date_dat$review_rating))##
## FALSE TRUE
## 3058 252date_dat %>%
select(release_date, date, yr) %>%
filter(is.na(date)) %>%
head()## # A tibble: 6 x 3
## release_date date yr
## <chr> <date> <chr>
## 1 2017 NA 2017
## 2 2013 NA 2013
## 3 2012 NA 2012
## 4 2013 NA 2013
## 5 2017 NA 2017
## 6 2017 NA 2017date_dat %>%
ggplot(aes(x = yr, y = review_rating, fill = yr)) +
geom_boxplot(alpha = .5) +
labs(x = "Release Year", y = "Review Rating") +
theme_light() +
theme(legend.position = "none")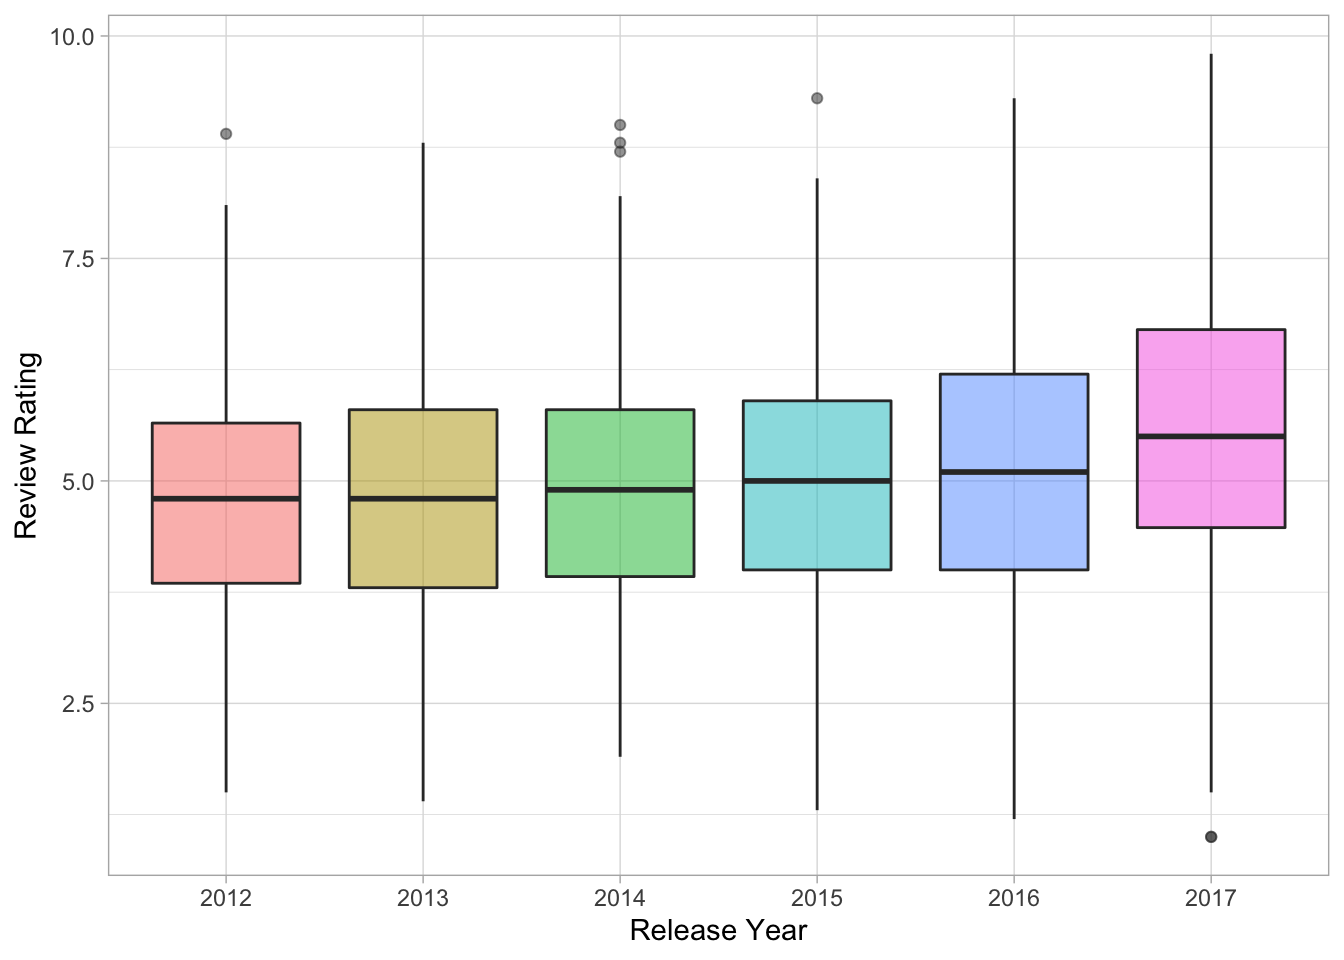
Looks like there is a slight increase in ratings for newer films.
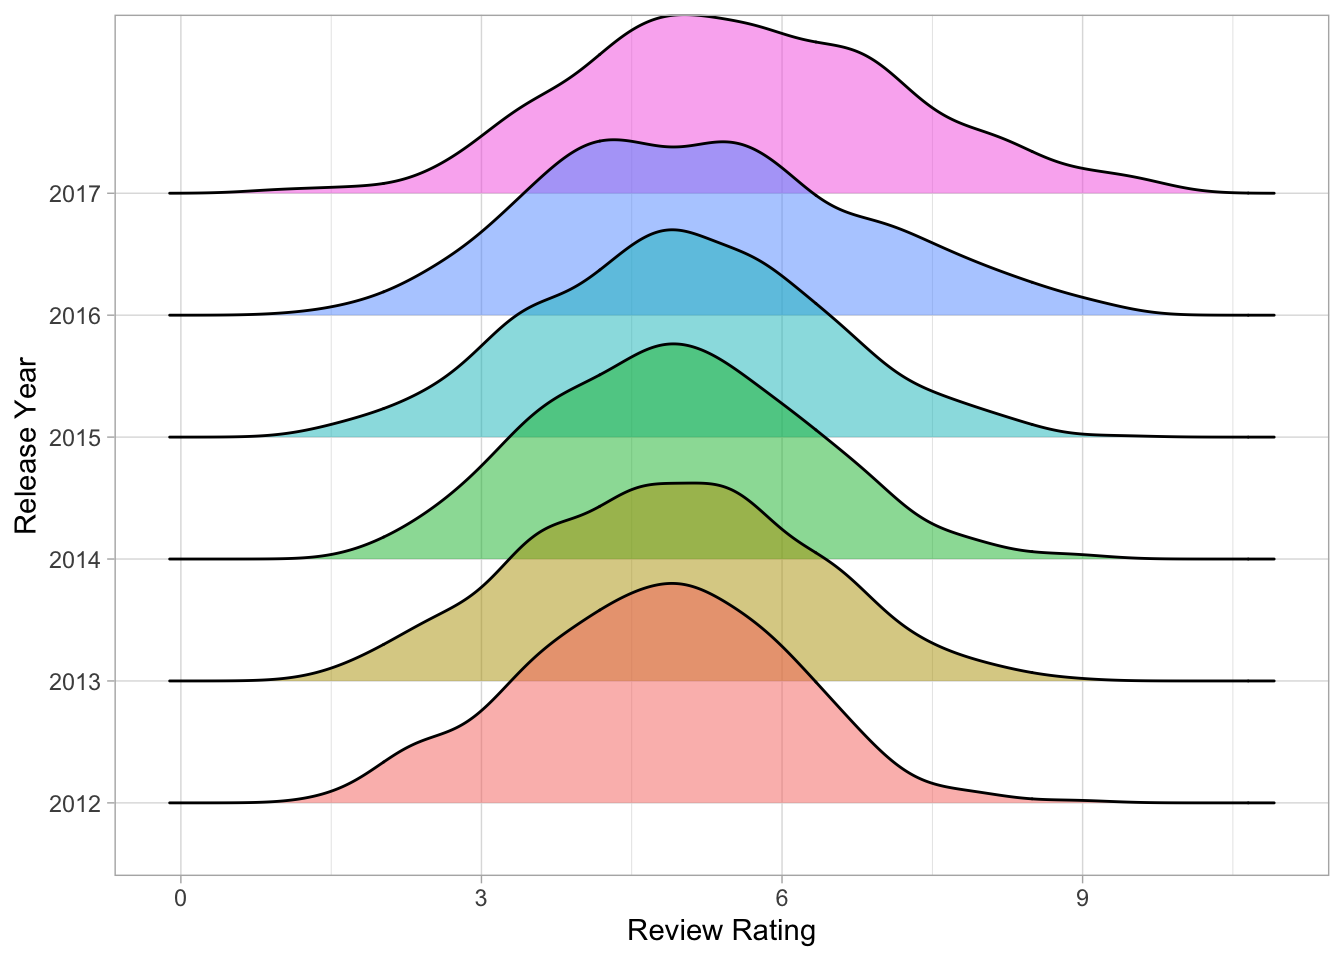
And here is a ridgeline plot :)
date_dat %>%
  ggplot(aes(y = yr, x = review_rating, fill = yr)) +
  geom_density_ridges(alpha = .5) +
  labs(y = "Release Year", x = "Review Rating") +
  theme_light() +
  theme(legend.position = "none")