Nepal Earthquake
I wanted to analyze the data from the April 2015 Nepal earthquake that resulted in around 10,000 deaths. I am using a dataset that I found in data.world. The data contains date, time, location and magnitude of the earthquake and the many aftershocks that followed. The data is updated as of June 2, 2015.
Nepal is my birthplace, my homeland. The earthquake was an extremely traumatic event for people who live there. Many people lost family members, their houses. I visited Nepal in 2017 and saw that every other house in Patan, Nepal (close to Kathmandu) was damaged. My relatives would talk about their experience of the earthquakes every day.
Libraries
library(tidyverse)
library(geojsonio)
library(broom)
library(gganimate)
library(leaflet)
library(widgetframe)
Read in the data and clean
earthquake_dat <- read_csv("https://raw.githubusercontent.com/meghapsimatrix/Data_Visualization/master/data/earthquake-0-csv-1.csv") %>%
  mutate(lab = paste0(Epicentre, "; ", Date,"; Magnitude(ML): ", `Magnitude(ML)`))

head(earthquake_dat)
## # A tibble: 6 x 7
## Date `Local Time` Latitude Longitude `Magnitude(ML)` Epicentre lab
## <date> <time> <dbl> <dbl> <dbl> <chr> <chr>
## 1 2015-06-01 04:35 28.0 85.5 4 Sindhupal… Sindhup…
## 2 2015-05-31 13:54 28.3 84.5 4.2 Lamjung Lamjung…
## 3 2015-05-30 22:13 27.8 85.2 4.5 Nuwakot Nuwakot…
## 4 2015-05-30 20:35 28.0 85.2 4 Rasuwa/Nu… Rasuwa/…
## 5 2015-05-30 01:52 27.8 85.2 4 Dhading /… Dhading…
## 6 2015-05-29 15:44 28 85.0 5.2 Dhading Dhading…# there is one entry where I think the lat and long are switched
summary(earthquake_dat$Latitude)## Min. 1st Qu. Median Mean 3rd Qu. Max.
## 26.94 27.71 27.82 28.06 27.98 84.71summary(earthquake_dat$Longitude)## Min. 1st Qu. Median Mean 3rd Qu. Max.
## 28.16 85.23 85.80 85.25 86.06 86.67# Gorkha seems like the lat and long are switched
(outlier <- earthquake_dat %>%
filter(Latitude == max(Latitude)))## # A tibble: 1 x 7
## Date `Local Time` Latitude Longitude `Magnitude(ML)` Epicentre lab
## <date> <time> <dbl> <dbl> <dbl> <chr> <chr>
## 1 2015-04-25 18:29 84.7 28.2 5.5 Gorkha Gorkha; …earthquake_dat <- earthquake_dat %>%
mutate(Latitude = if_else(lab == outlier$lab & Date == outlier$Date, outlier$Longitude, Latitude),
Longitude = if_else(lab == outlier$lab & Date == outlier$Date, outlier$Latitude, Longitude))
# Sindhupalchowk seems like the Longitude is wrong
earthquake_dat %>%
filter(Longitude == min(Longitude))## # A tibble: 1 x 7
## Date `Local Time` Latitude Longitude `Magnitude(ML)` Epicentre lab
## <date> <time> <dbl> <dbl> <dbl> <chr> <chr>
## 1 2015-05-08 08:19 27.8 28.9 4.2 Sindhupal… Sindhup…sindhupalchowk <- earthquake_dat %>%
filter(str_detect(Epicentre, "Sindhu"))
# Mean imputing based on other values for Sindhupalchowk
earthquake_dat <- earthquake_dat %>%
mutate(Longitude = if_else(Longitude == min(Longitude), mean(sindhupalchowk$Longitude), Longitude))Make a Map of Nepal
I got the code for the base map from here.
np <- geojson_read("https://raw.githubusercontent.com/mesaugat/geoJSON-Nepal/master/nepal-districts.geojson",  what = "sp")
np_dat <- tidy(np)


# plot
np_plot <- ggplot() +
  geom_polygon(data = np_dat, aes( x = long, y = lat, group = group))

np_plot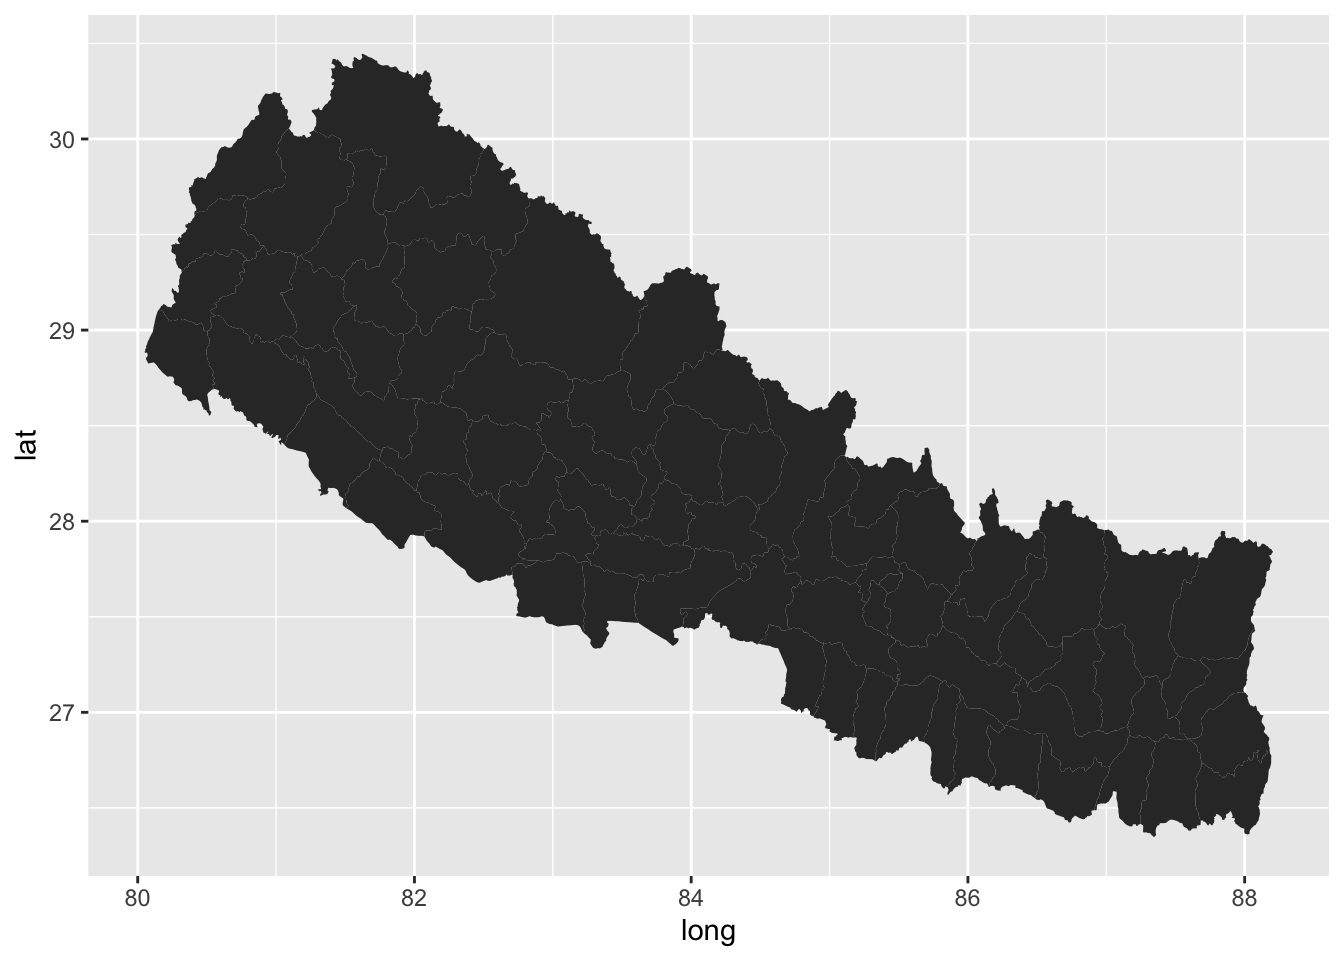
Mapping on the Earthquake and Aftershocks
Now plotting the latitude and longitudes. Size indicates the magnitude of the earthquake.
(np_earthquake <- np_plot +
  geom_point(data = earthquake_dat,
             aes(x = Longitude, y = Latitude,
                 size = `Magnitude(ML)`),
             color = "red", alpha = .5) +
  labs(color = "") +
  theme_void() +
  theme(legend.position = "none"))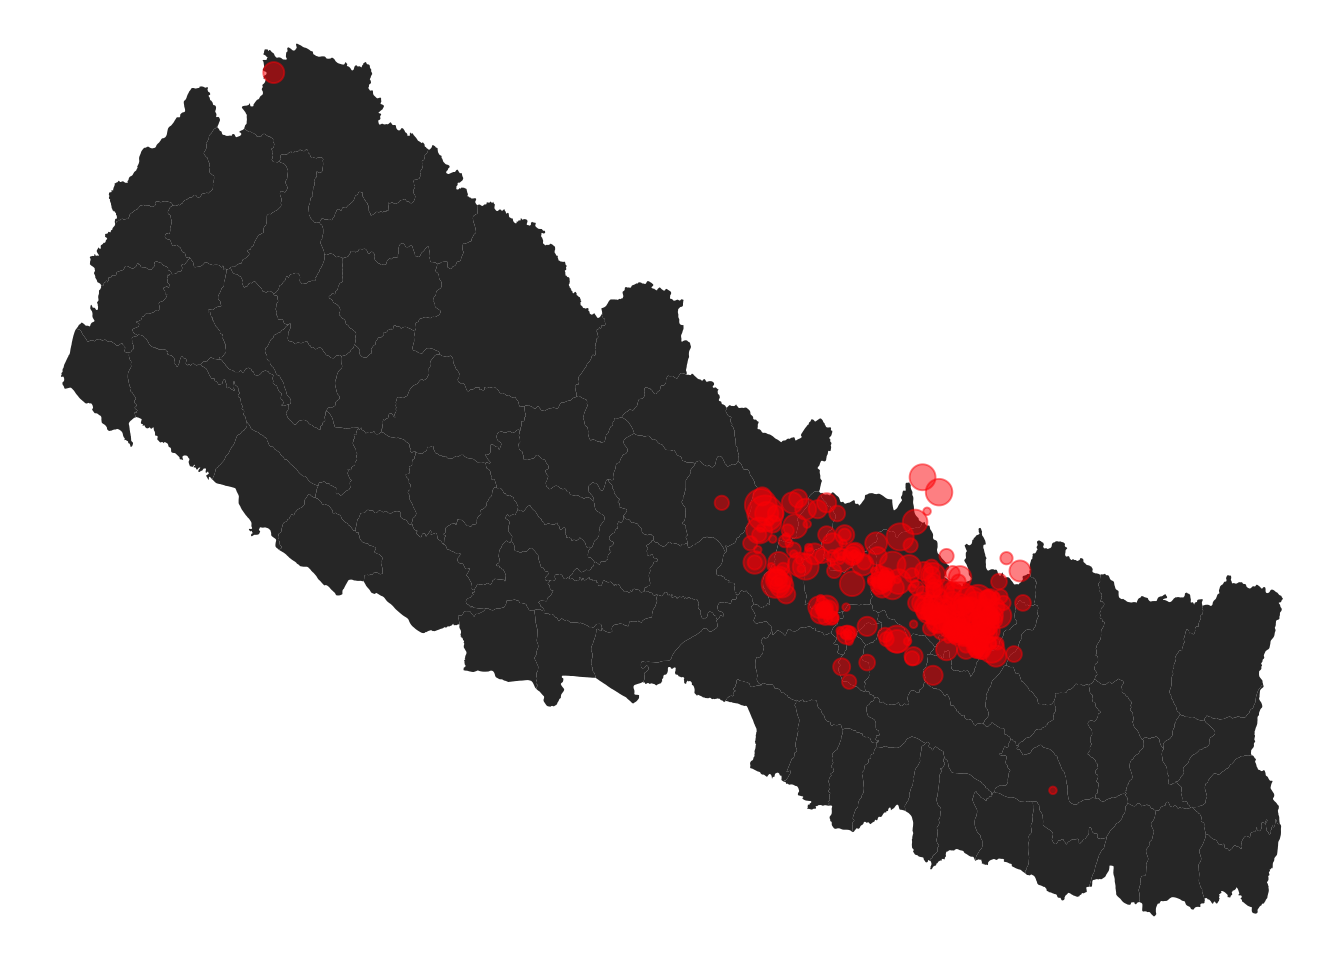
Animating
np_animate <- np_earthquake +
  transition_states(Date) +
  labs(title = 'Date: {closest_state}') +
  enter_appear() +
  exit_disappear()

animate(np_animate)
Leaflet
Created using the leaflet package. Click on the dots on the map to learn the location, date, and the magnitude of the earthquake or aftershock.
np_leaf <- leaflet(earthquake_dat) %>%
  setView(lat = 27, lng = 85, zoom = 7) %>%
  addProviderTiles(providers$CartoDB.DarkMatter) %>%
  addCircleMarkers(~Longitude, ~Latitude,
                   radius = ~`Magnitude(ML)`, fillOpacity = 0.5,
                   popup = ~lab, stroke = FALSE)

frameWidget(np_leaf)